

Case study 1 of 5 · Cisco · Webex Console
Stopping toll fraud in seconds, not minutes
I designed fraud monitoring for Cisco's Webex Calling operations console. Blocking used to wait 5 minutes after detection; with detection and blocking automated, it now happens in seconds, from one place instead of four systems.
| Role | Sole UX designer: research, interaction design, specs, stakeholder reviews |
|---|---|
| Users | Network engineers and security analysts; senior engineers and management for oversight |
| Timeline | 2 months of UX, then a 1-month MVP rework about 1.5 years later |
| Worked with | Product and project managers, developers, operations |
| Tools | Miro, Balsamiq, Figma, Cisco's Momentum design system |
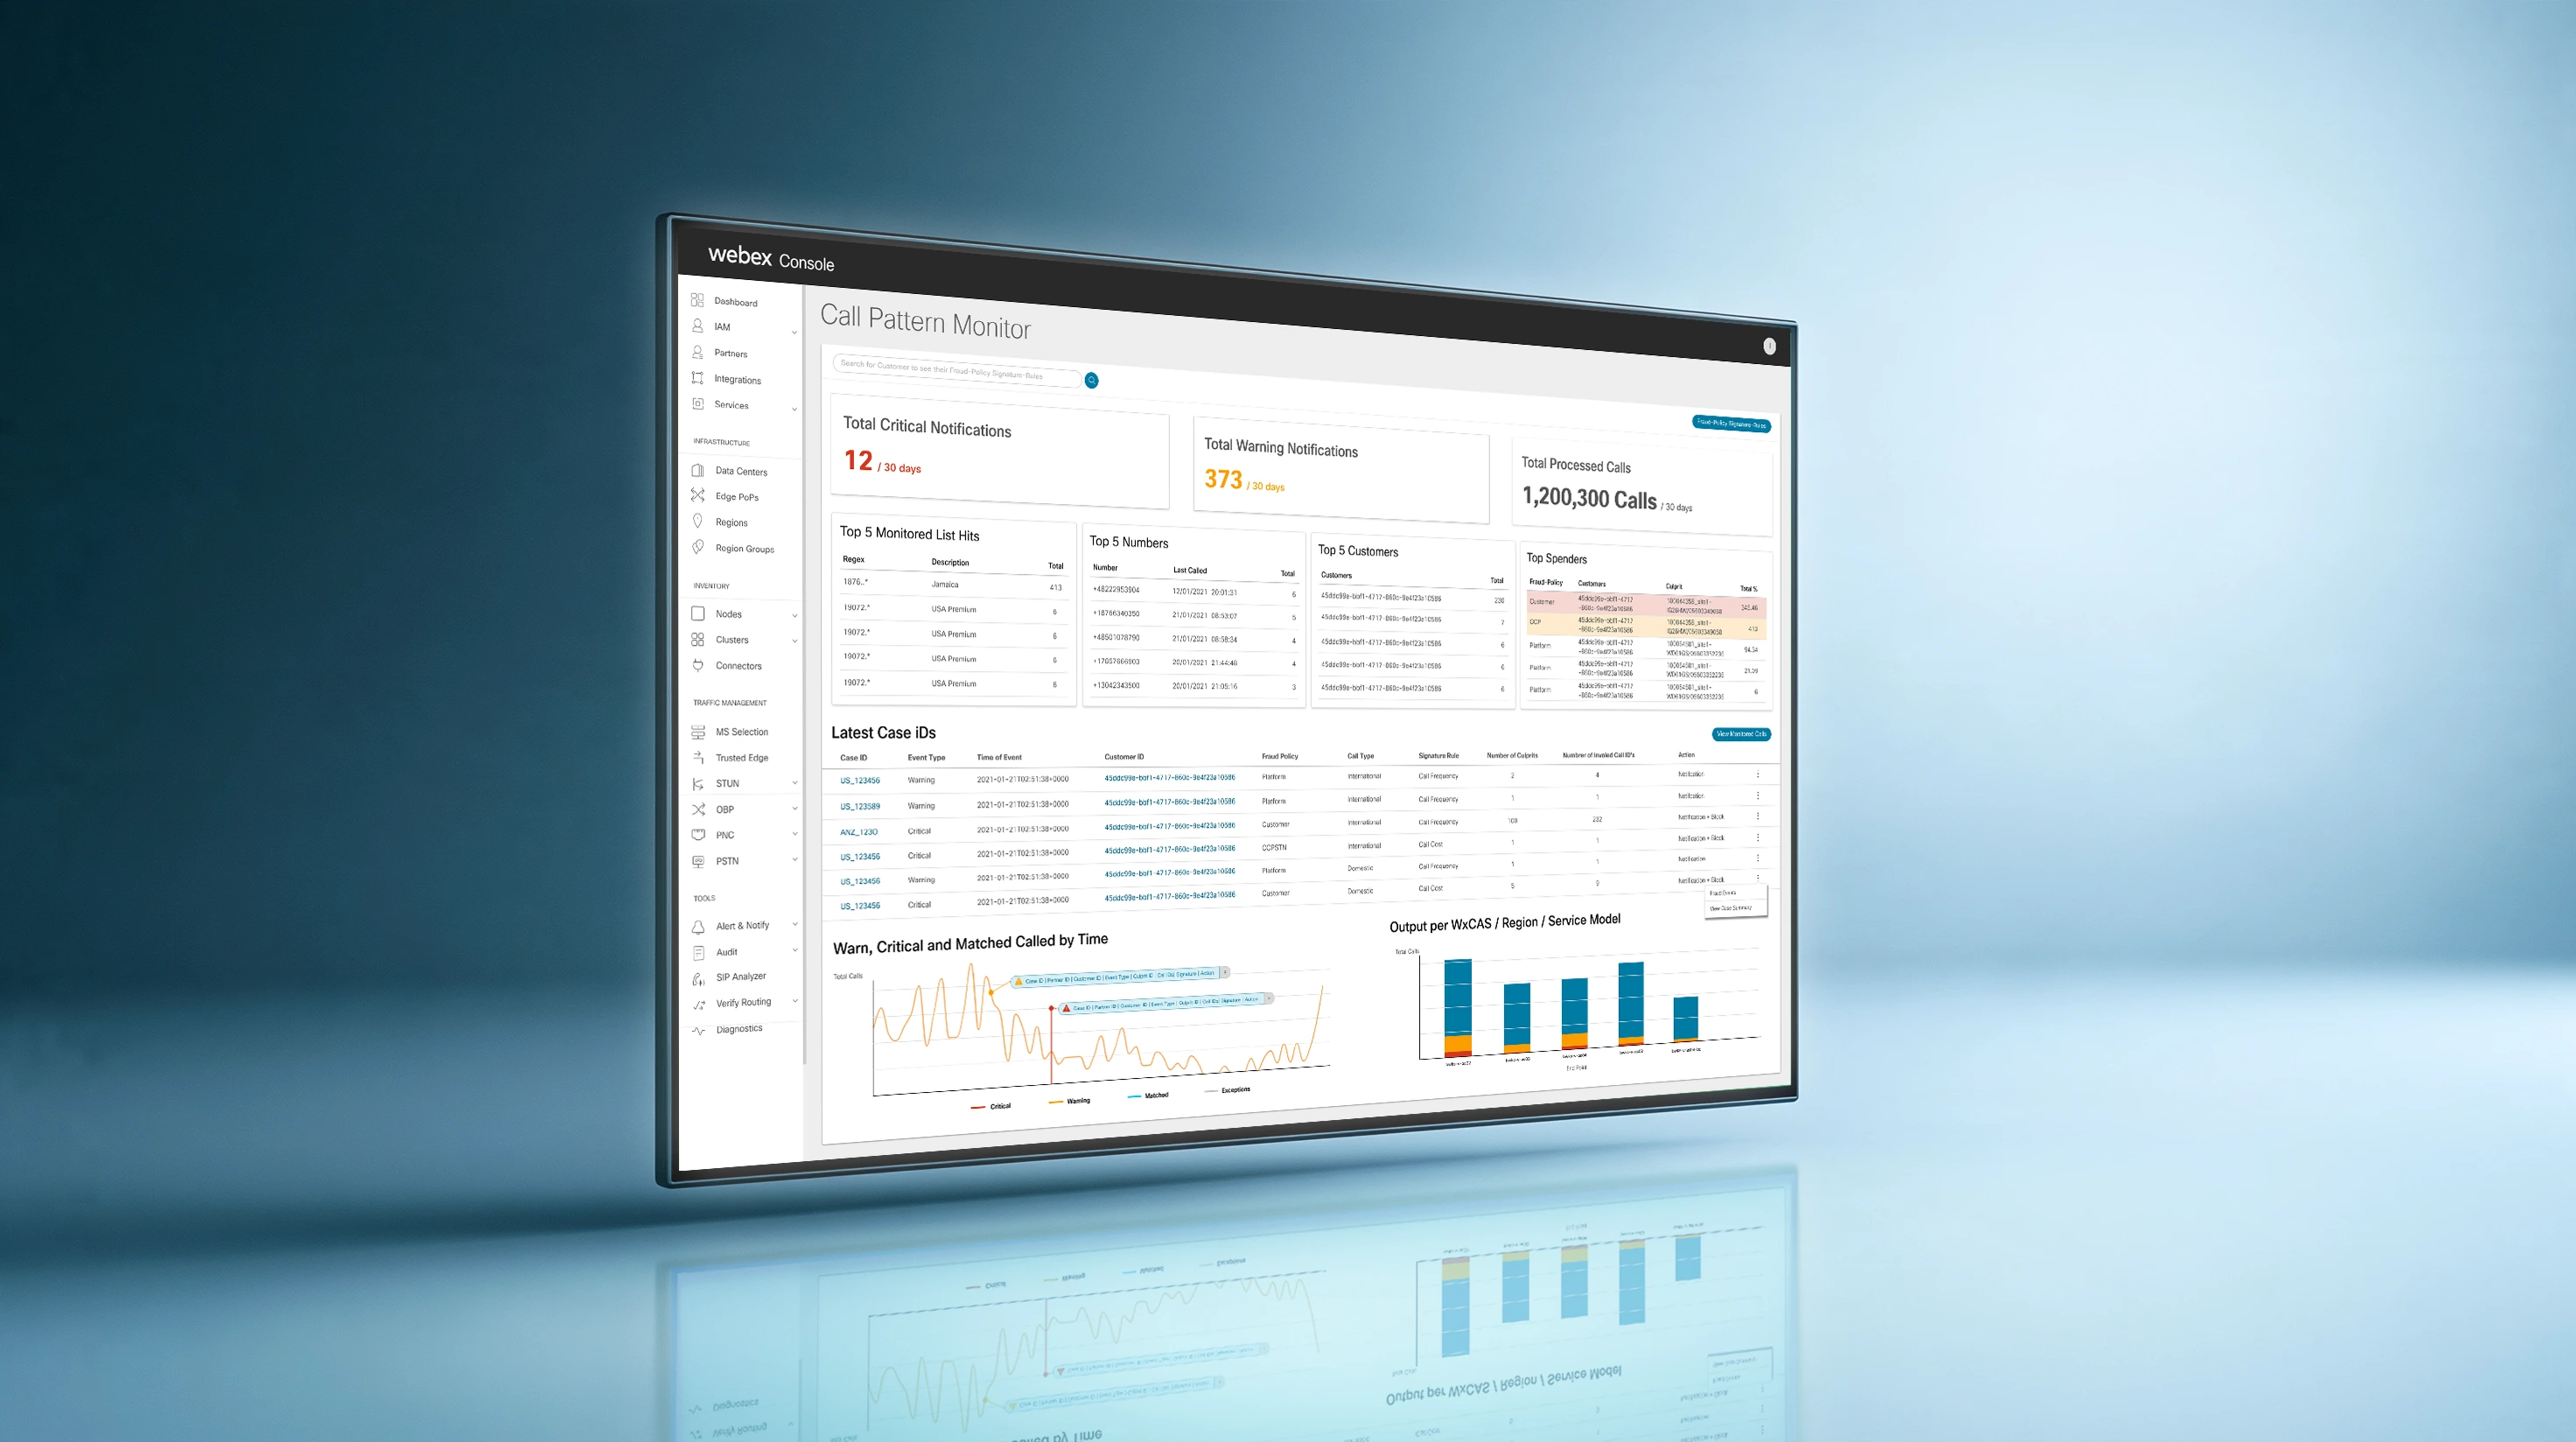
Screens are redrawn or blurred with invented data. The original work is under NDA.
A 5-minute delay let fraudsters make hundreds of calls
Investigating a fraud event took up to 15 minutes across 4 systems and 5 processes.
Fraud detection protects Cisco's revenue and legal compliance, but the process was slow and manual. Blocking came 5 minutes after detection, long enough for a bad actor to complete hundreds of calls.
The question we started with: how can we make fraud detection faster and more effective for the people who have to act on it?
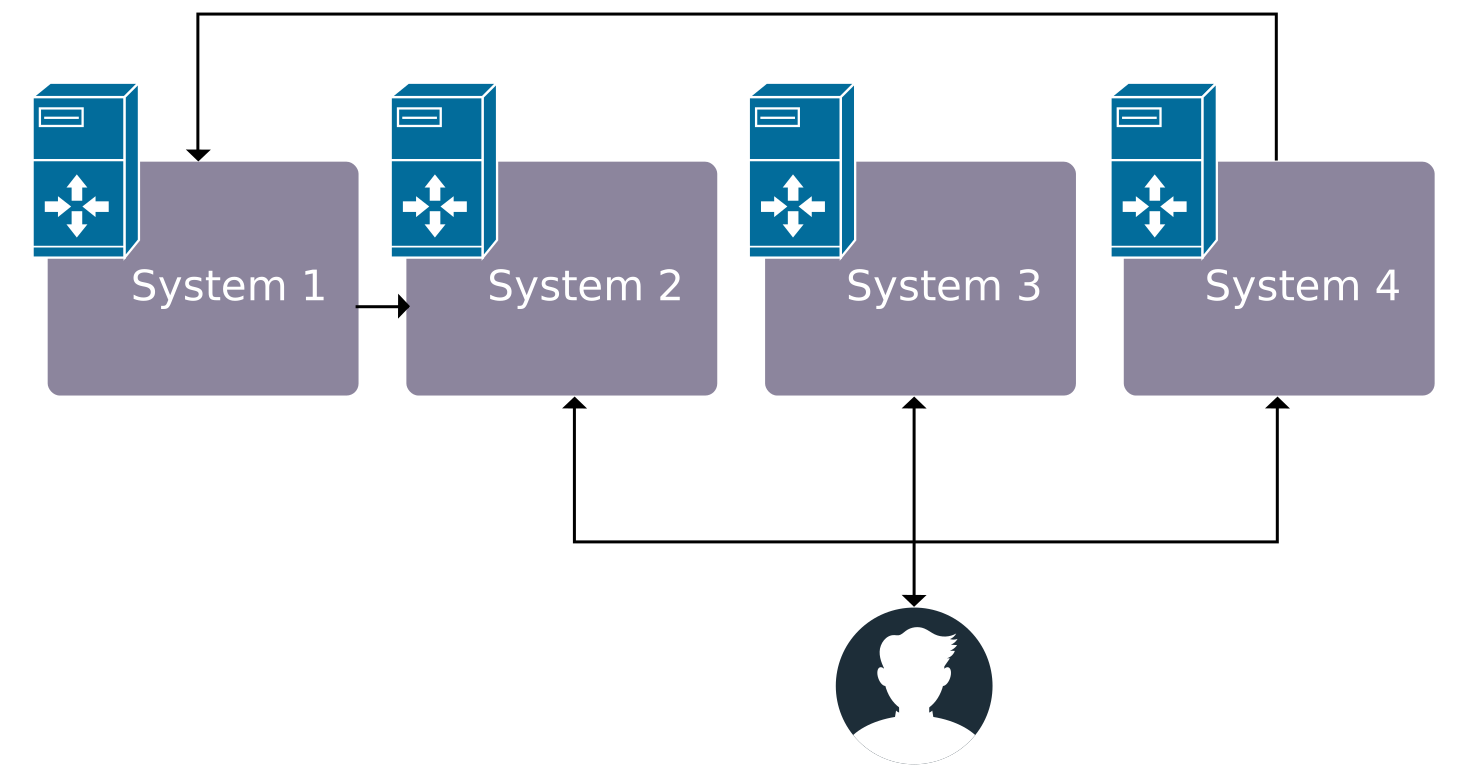
Why it was hard
- Three levels of ownership. Cisco operations, partners (resellers) and their customers each needed their own rules.
- Dense, technical data. Call records, risk ratings by destination, cost and frequency thresholds, regex digit patterns.
- High stakes either way. Blocking a calling plan cuts off a real business, while doing nothing costs money.
Engineers juggled 4 systems to answer one alert
Too many alerts, too little context, and manual steps everywhere.
I interviewed 5 security analysts and network engineers, shadowed 2 of them through 15 real tasks, and reviewed help-desk tickets. With the developers I then checked the APIs: detection and blocking could run automatically, but users still needed to see and control them.
"It works. It's just clunky and a pain to deal with. We shouldn't manually have to deal with this."
Research details
The team had never worked with a designer before, so part of my job was making room for user research at all.
| Walkthrough | A senior engineer presented the existing system and I read the documentation; I mapped the current journey: 4 systems, 5 processes |
|---|---|
| Interviews | 5 sessions of about 30 min with 2 security analysts and 3 network engineers, 20 questions sent beforehand |
| Shadowing | 2 recorded sessions of 45+ min, 15 task-based assignments in the existing tools |
| Help desk | Top tickets included "I think this is a false positive, can you check?" and region rule updates |
| Competitors | Dashboards and fraud overviews in comparable products |
Three user groups came out of it: day-to-day operators, senior engineers who also plan and allocate work, and management wanting a monthly overview.
What else users said
"I want a concise overview of our fraud effectiveness over time... something I could show to management."
"I think this can be better... we need to make it more customizable, to add flexibility."
What we learned
- Too many alerts, no triage. Engineers spent much of their time filtering alerts and struggled to prioritise.
- Missing context. Analysts lacked the information to judge the impact of a fraud event and act on it.
- Manual, slow response. Engineers moved between tools and debugged in the SIP Analyzer outside the console.
I synthesised the findings in an affinity map with three clusters, detection, alert and action, marking every step as manual or automated and noting which manual steps could be automated. A deep dive into the APIs with the developers confirmed what automation could do, what data could support a dashboard, and what would fit the timeline.
One path: see the risk, open the case, act
A dashboard of fraud activity, a case view with the evidence, and one-click actions.
The first design followed the path an operator takes. A dashboard showed critical and warning totals, top-5 tables and trends. A case slide-out showed the rule that fired and the calls behind it. "Block calling plan" and "Tear down calls" worked in one click, each with a confirmation that said what would happen.

How I got there
I mapped two paths through the data: a history path (what happened, when, where) and an action path (what can be done, singly or in bulk). From these I picked the golden paths, the tasks users would do most, and storyboarded four: being alerted, checking past fraud, setting up an alarm, and flagging, holding or taking down an event.
Rough Balsamiq mock-ups built on Cisco's existing patterns came first, then Figma. Supporting screens covered the monitored country list, a whitelist, platform-wide monitored calls and regex digit patterns.

Testing and feedback
The first concept went through several rounds of stakeholder reviews. I kept the early mock-ups deliberately rough so people discussed the flow, not the visuals. For the last rounds I brought the developers in, so they heard users first-hand and could answer automation questions and estimate the build.
Then came Figma prototypes: one-to-one sessions where I shadowed users through their tasks, while stakeholders used the mock-ups in demos and sales pitches and fed notes back. One point from engineers came up more than once: actions hidden in row dropdown menus should come out onto the page.
The hard part: rules at three levels
Cisco, each partner and each customer could set rules, and users needed to know which one applied.
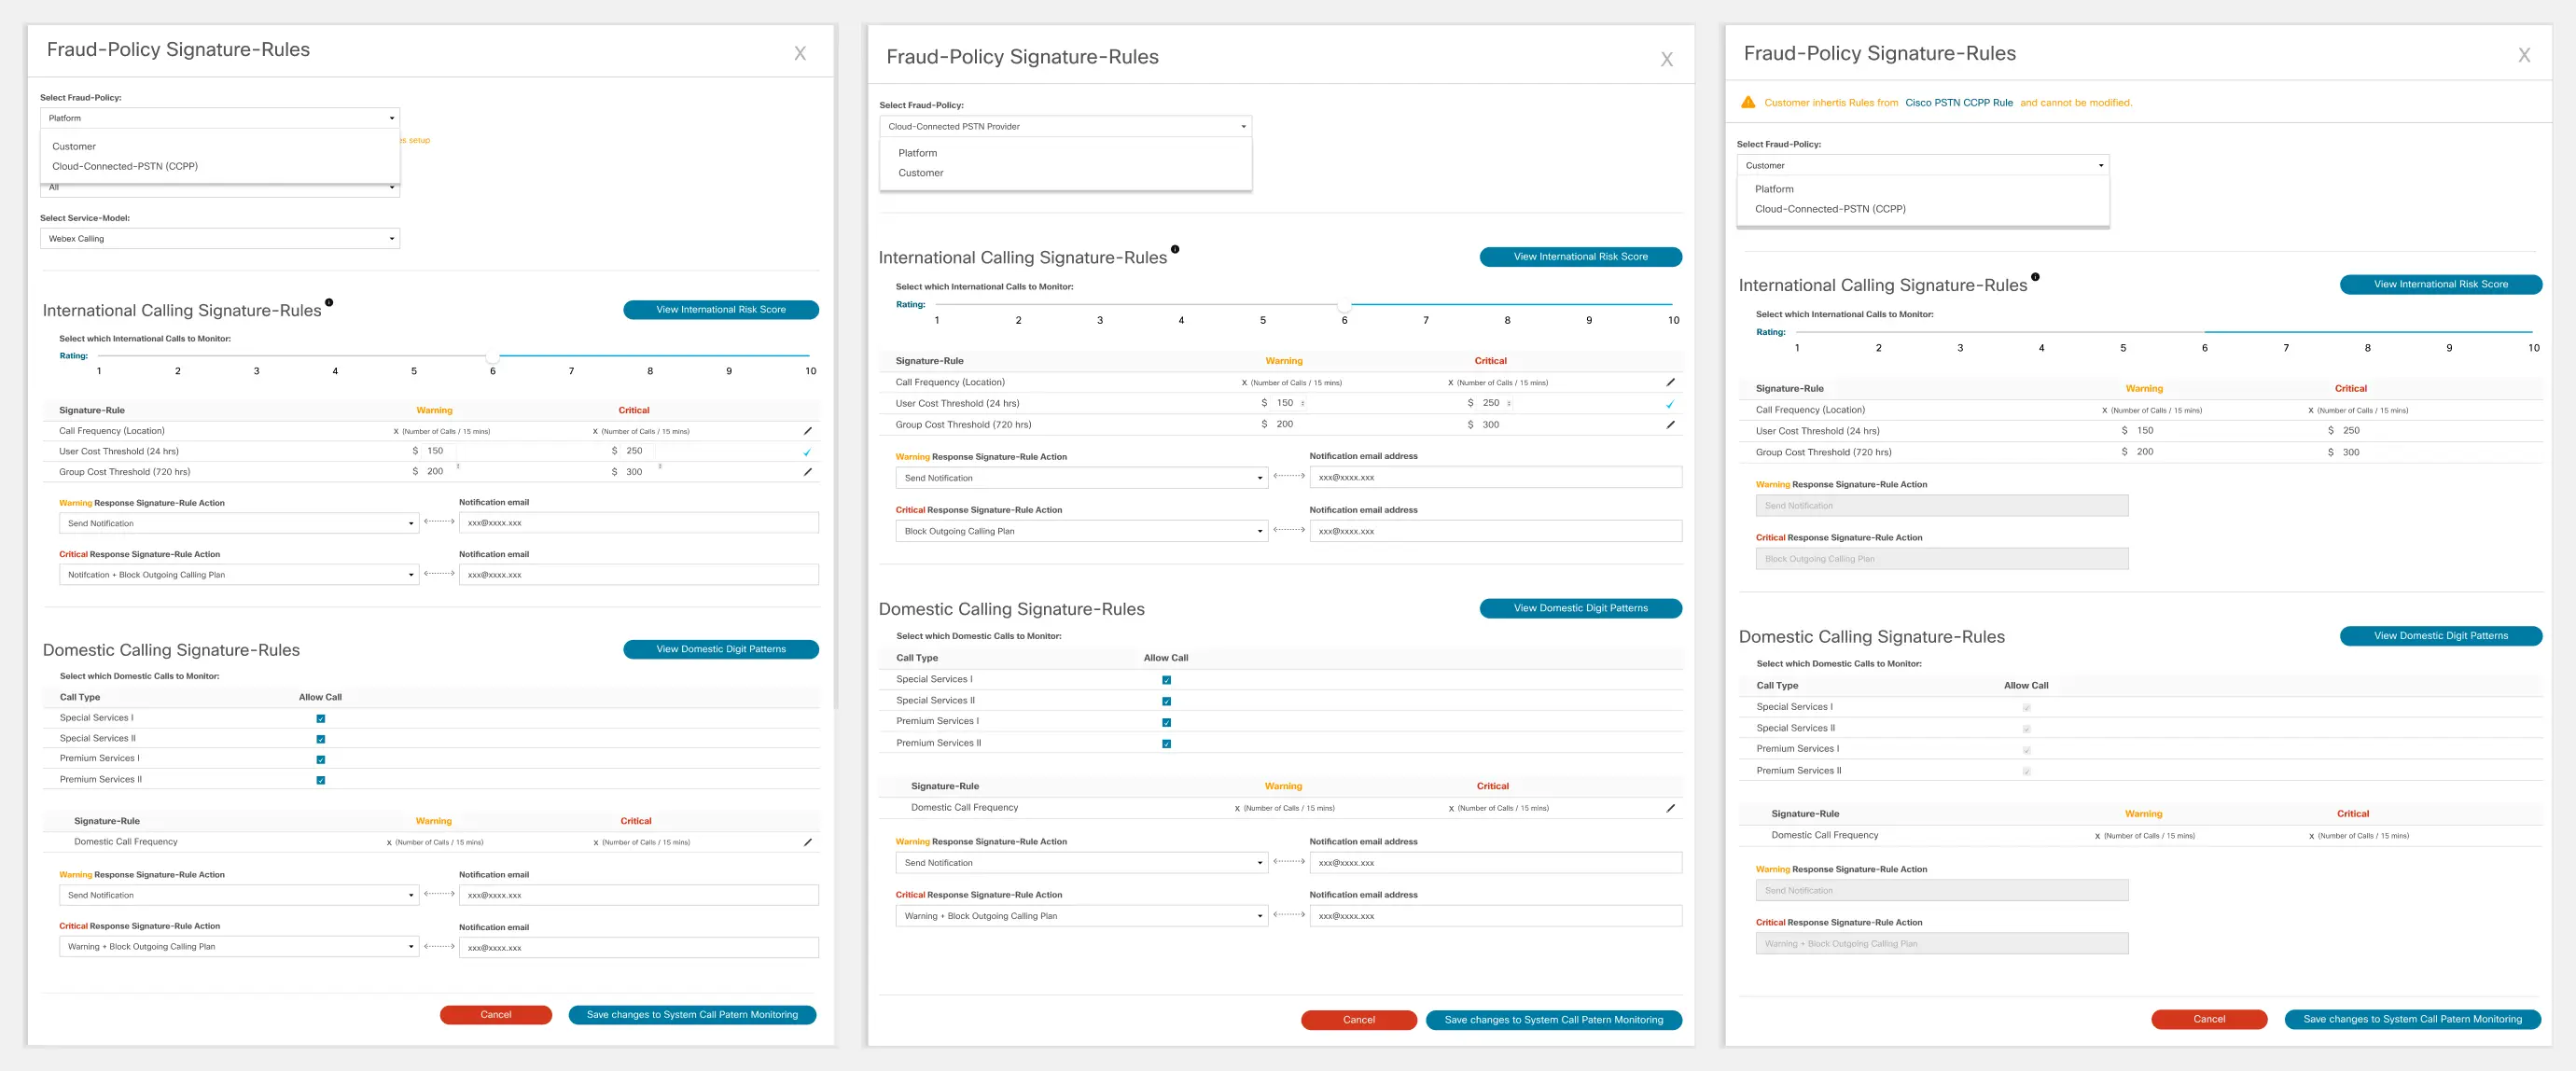
Rules flow down from the platform to partners to customers, and the lowest level that sets them wins. A customer with no rules of its own sees what it inherits, read-only, under a banner saying where the rules come from.
See the rules screens
The same Fraud-Policy Signature Rules screen at each level: international calls monitored by risk rating, warning and critical thresholds for call frequency and cost, domestic call types, and the action each threshold triggers. On the Customer screen, inherited rules are greyed out with a banner naming their source.
A reorg froze it for 1.5 years, so I cut it to a buildable MVP
Weeks before development, a management reshuffle shelved the feature. It came back with a much tighter timeline.
With no time to redo the UX, I worked lean. With the developers I sized the automation work first, the core of the feature, and with the project manager I cut the scope to the golden paths:
- Alarms, automated and not configurable at first
- A list of detected fraud events: time, location, origin, destination
- Actions on each event: block the calling plan or tear down calls
Everything else went into a V2 backlog. Many stakeholders were unhappy, but they agreed the MVP on the promise of a V2.
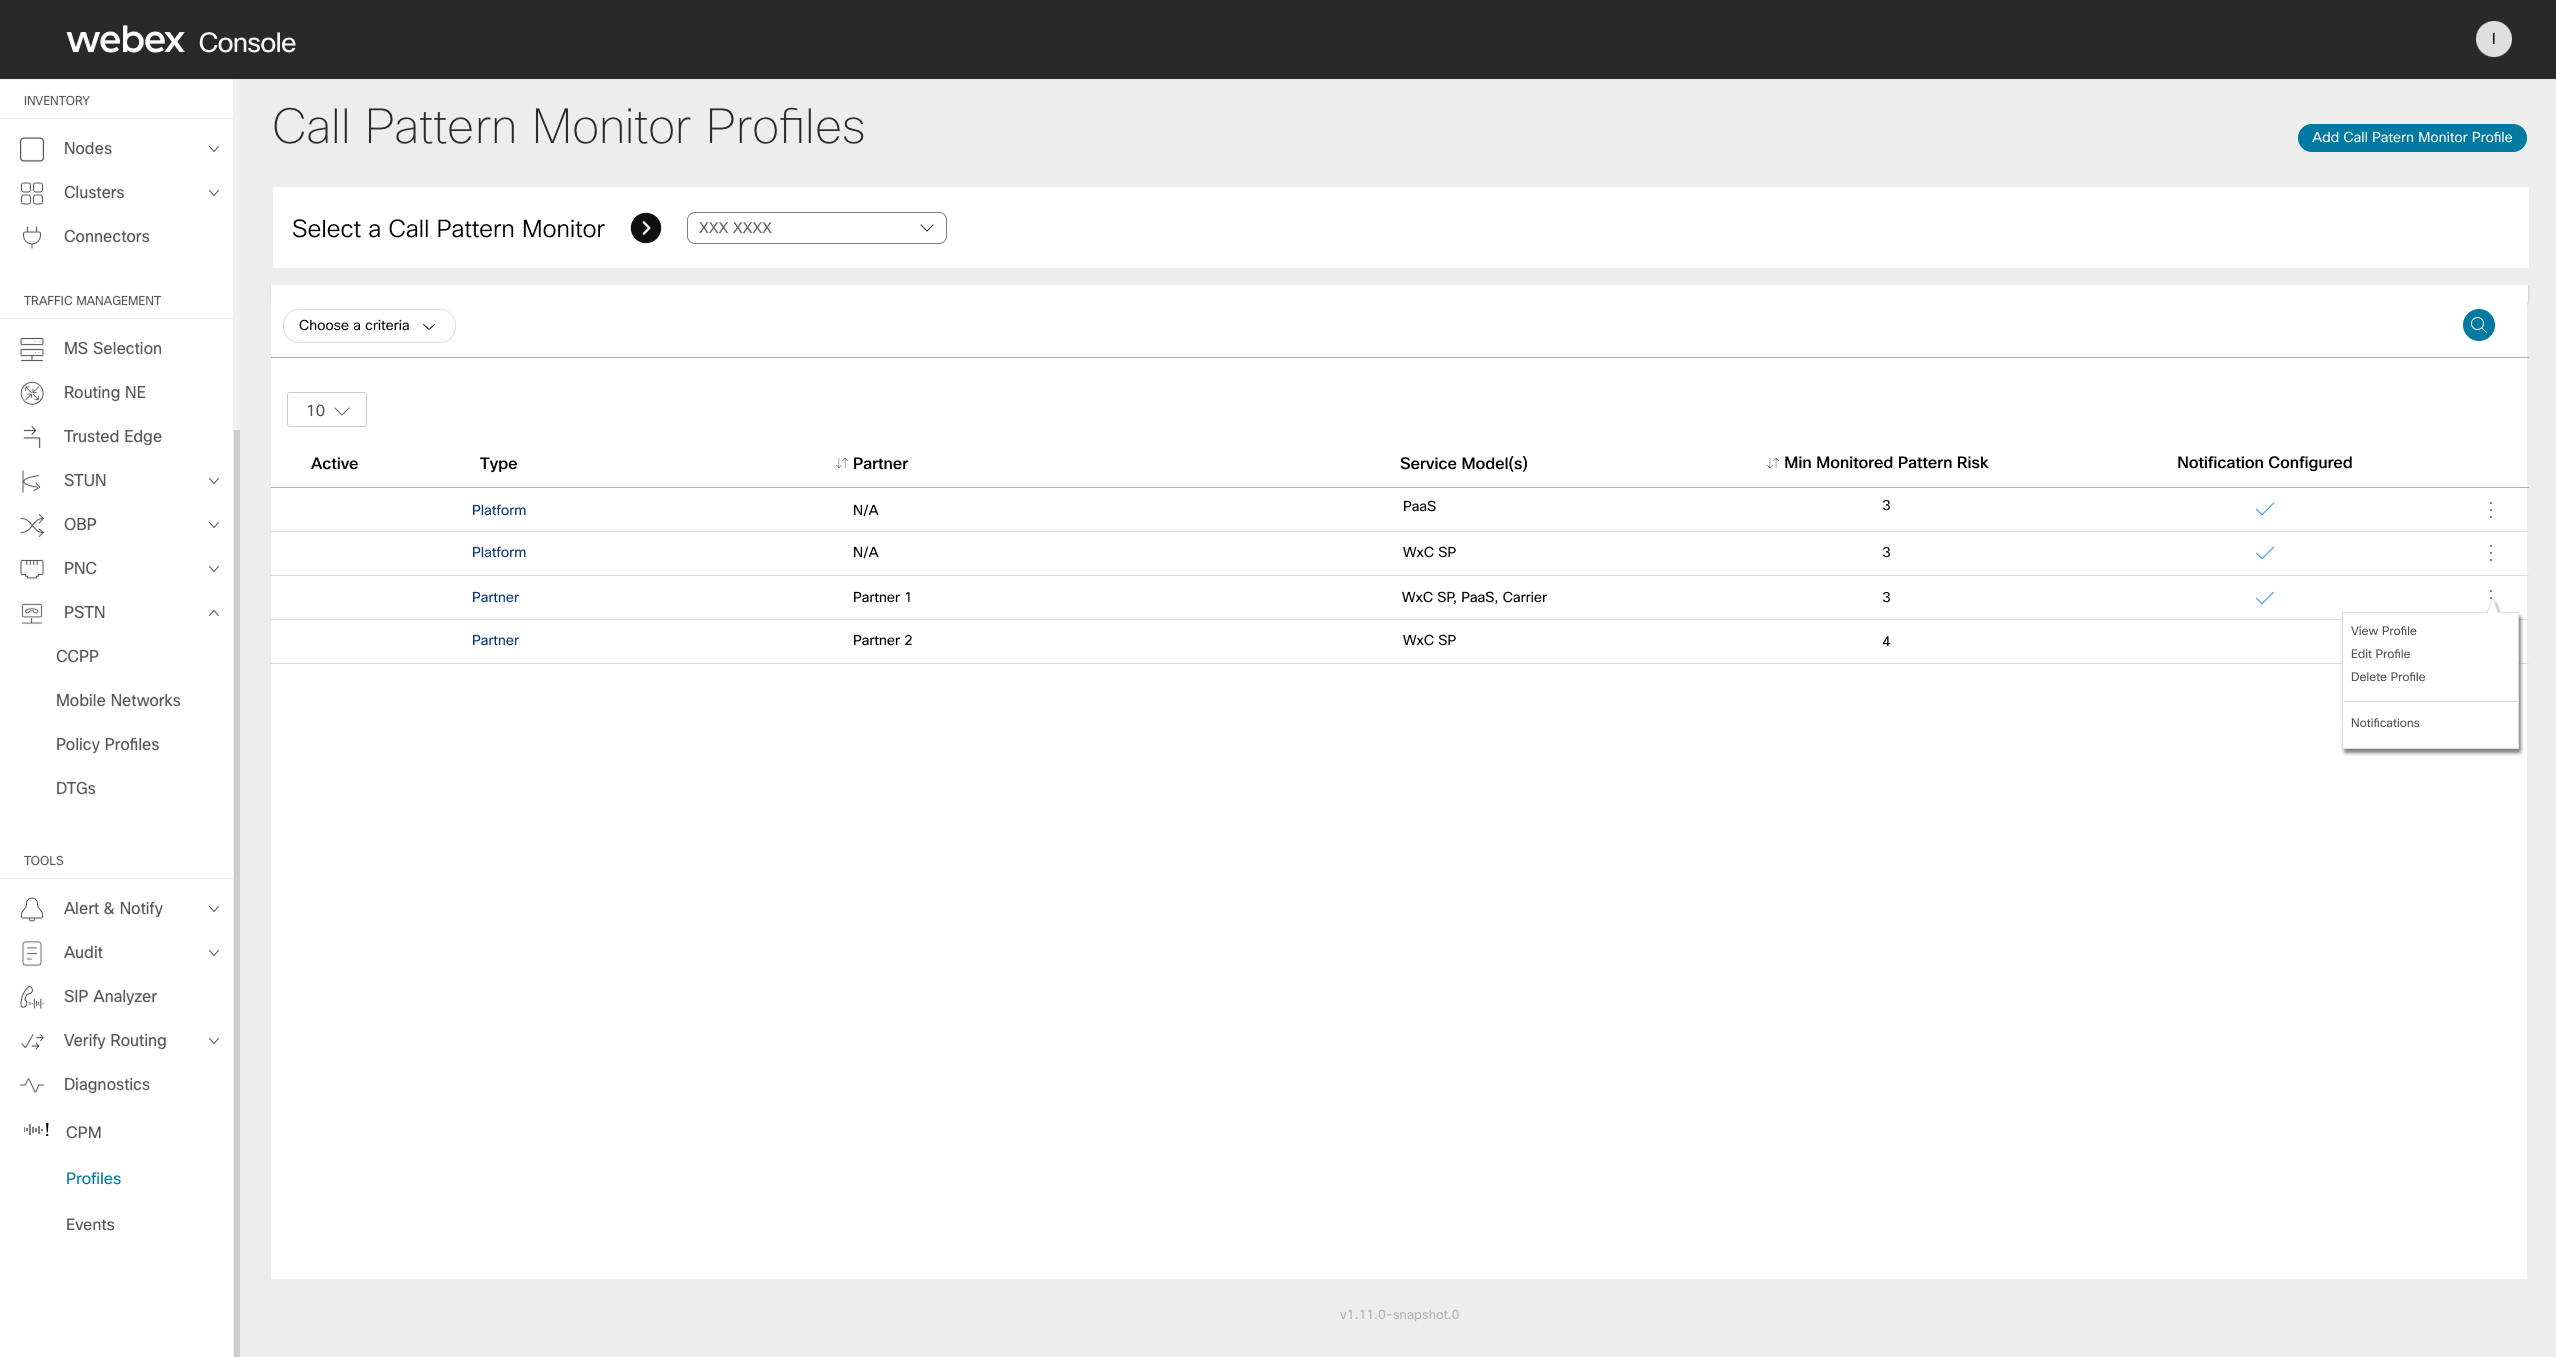
How the specs reached the developers
| First design | MVP |
|---|---|
| Dashboard with totals, top-5 tables and charts | Deferred to V2 |
| Rules and thresholds set at each level | Alarms automated, not configurable |
| Customer drill-down and case history | One list of detected fraud events |
| Case slide-out with block and tear-down | Same actions from each event's menu, with confirmations |
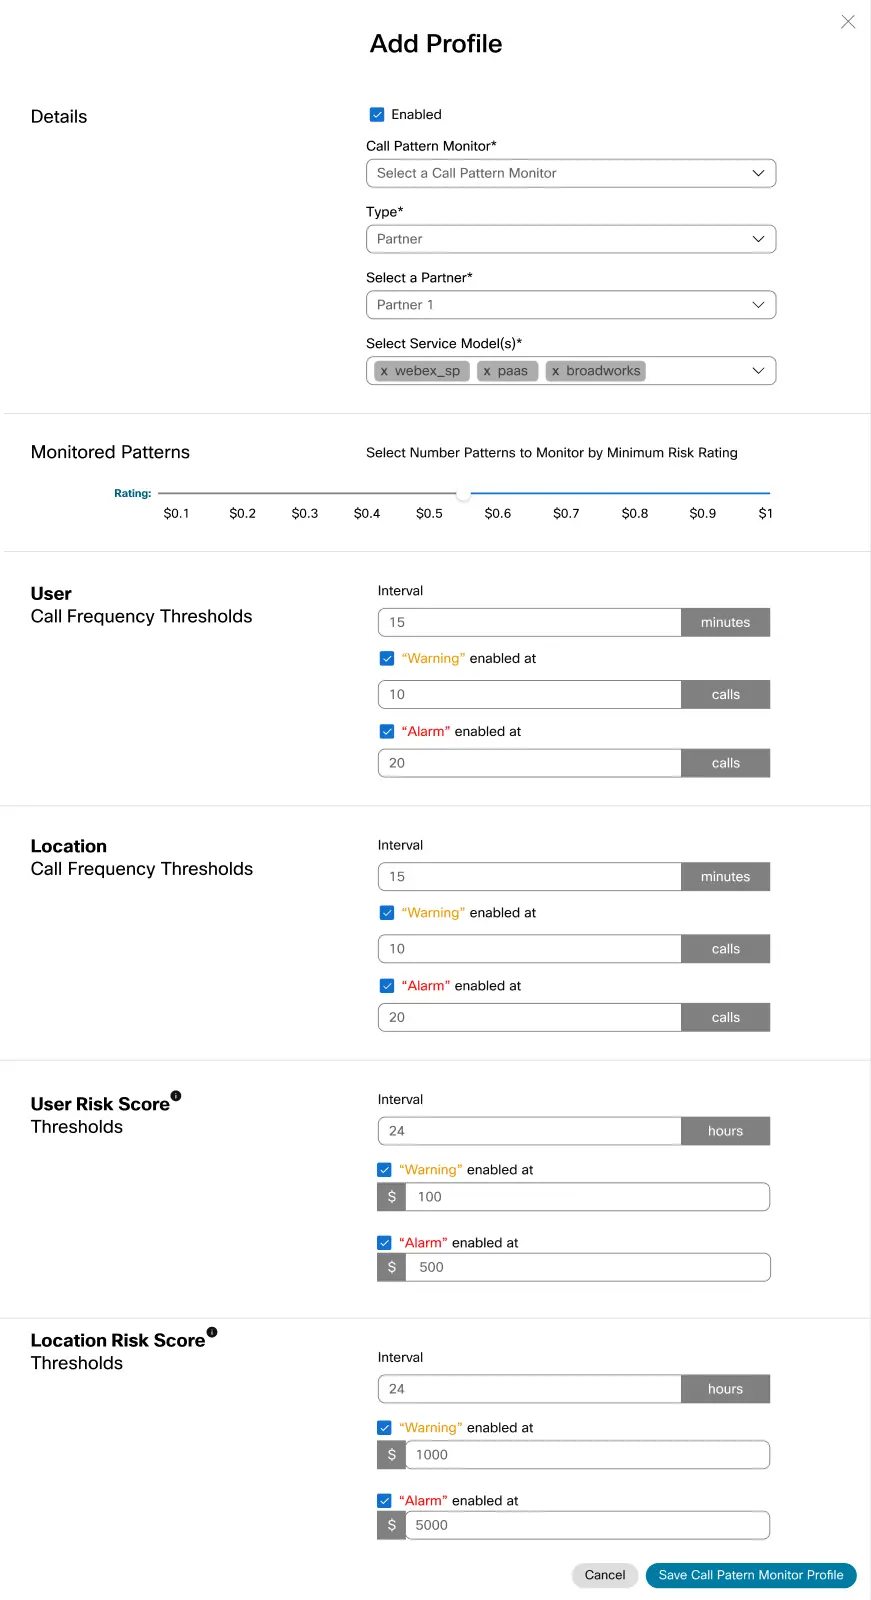
The developers started from rough mock-ups. I stayed in constant contact and produced high-fidelity screens just ahead of them, for the MVP and for V2, built from Momentum components, with the API endpoint and a sample payload beside each one so every field on screen mapped to a field in the data. Notes I wrote on the frames:
- Selection first. Every list depends on the chosen Call Pattern Monitor, so that picker gets a large label and an arrow to draw the eye.
- No separate "Enabled" field. Turning a warning type off hides its fields: one fewer control.
- No delete for notification types. The system cannot delete them, so the design offers no button that would fail.
- Popover icon, not hover. Event details open from a visible icon; hover alone would not be discovered.
- Risk rating as a scale. In read-only views the slider handle becomes a monitor icon, so it doesn't look adjustable.
The MVP was not tested before release. The timeline didn't allow it, so we tested in production, workable only because this was an internal tool. I logged the feedback for V2.
Result: blocking in seconds, and one place to work
The MVP shipped with detection and blocking automated.
| Measure | Before | After |
|---|---|---|
| Detection to blocking | 5-minute delay | Seconds, automated |
| Investigation | Up to 15 min across 4 systems | One console |
Informal feedback was very positive: engineers were relieved to stop switching between systems.

V2 backlog and what I learned
I left Cisco before V2 was built, so this is the plan rather than the result. Each item can return on top of what shipped, without a redesign.
| V2 backlog | Why it matters | How I'd bring it back |
|---|---|---|
| Dashboard: totals, top-5 tables, charts | Management's top request | A summary strip above the events list first; charts once there is usage data |
| Filtering and triage status | Too many alerts to sort through | Filters plus a looked-at / addressed status column |
| Event detail and history | Analysts need context to judge an event | A detail view per event with its calls and the rule that fired |
| Configurable alarms, customer-level rules | "Make it more customizable" | Profiles per Platform and Partner first, then Customer, inherited rules read-only |
What I took from it
- Design the whole path, then cut. Because the first design was complete, cutting to an MVP took one month instead of a restart.
- Bring developers in early. The API deep dive during research showed what could be automated, which became the core of the feature.
- Protect testing, even in an MVP. On a customer-facing product I would hold out for at least one round of task-based testing before release.
- Make inheritance visible. In a multi-level system the hardest question is "which rule applies here, and who set it?"