

Case study 3 of 5 · Design exercise · 2023
Clinical trial review: charts, data and notes on one screen
A 48-hour design exercise for a job interview. Reviewers on a clinical-trials analytics platform check adverse-event data, then record observations and actions. The current screens split that work across tabs, and the team wanted to see how I would fix it.
| Type | Design exercise for a job interview, October 2023 |
|---|---|
| Time | 48 hours |
| Role | Solo: audit, interaction design, visual design, clickable prototype |
| Tools | Figma |
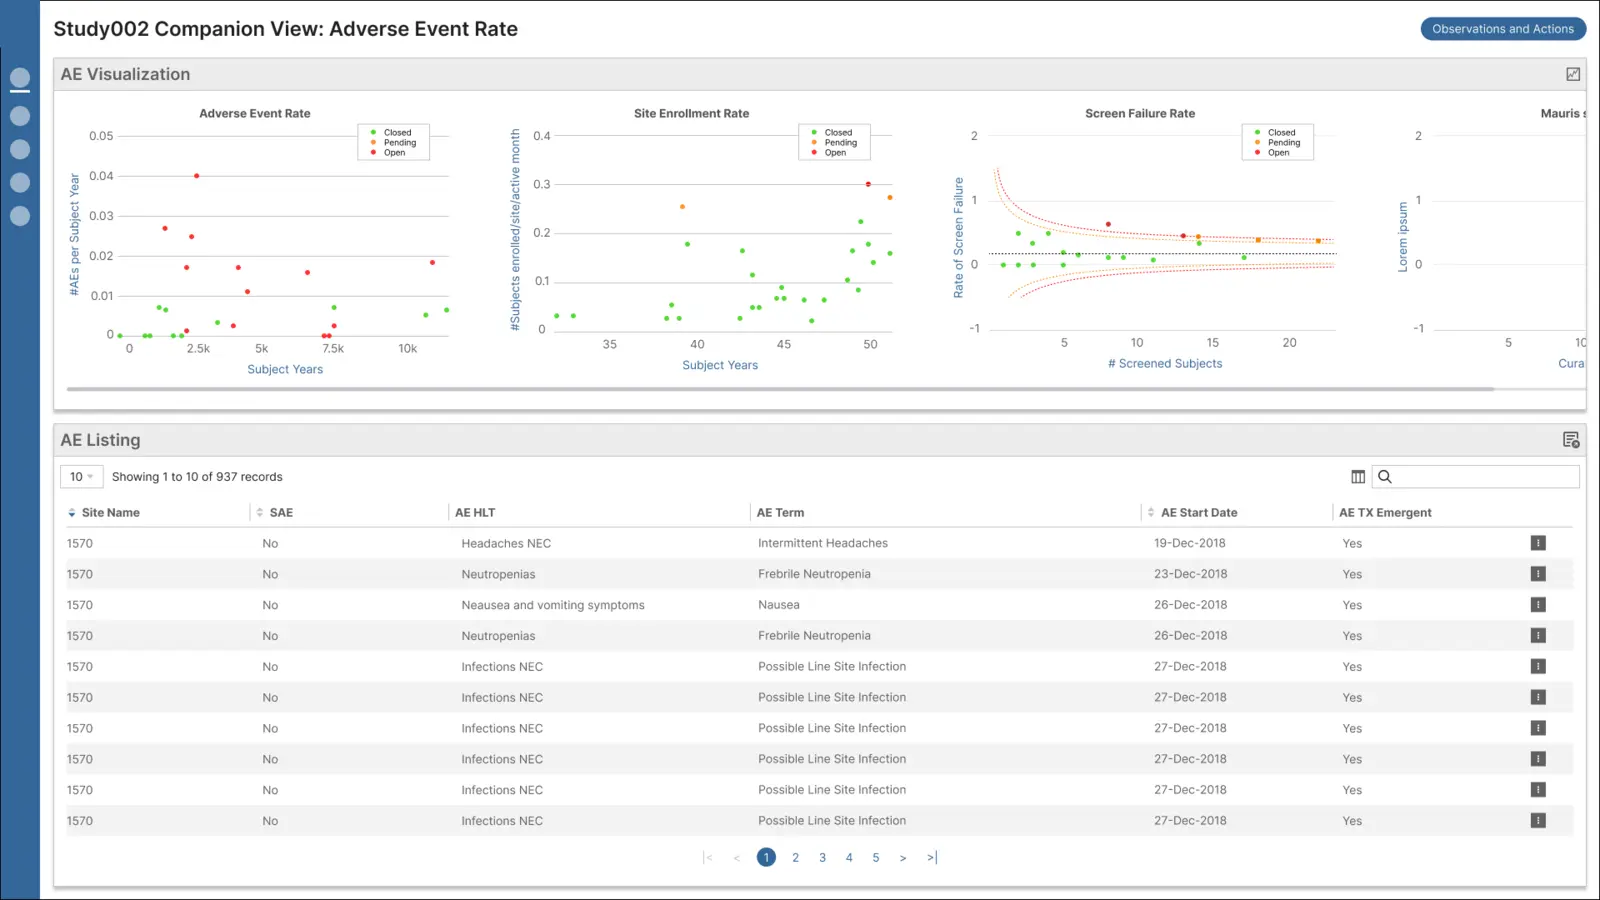
Shown without the company's branding. All data is placeholder.
The brief: five problems with the current view
Graphs and tables lived on separate tabs, and the screens were grey and cramped.
- Graphs and tables sat on separate tabs.
- The layout had to handle large volumes of data.
- Reviewers needed to read and create notes quickly.
- The layout needed some flexibility.
- The visual design was very grey and wasted space.
I started by auditing what was there
Half the brand colours failed WCAG contrast, and several controls didn't explain themselves.
Before designing anything, I went through the current product screen by screen, noting usability issues and questions for the team, and checked the brand palette for contrast.
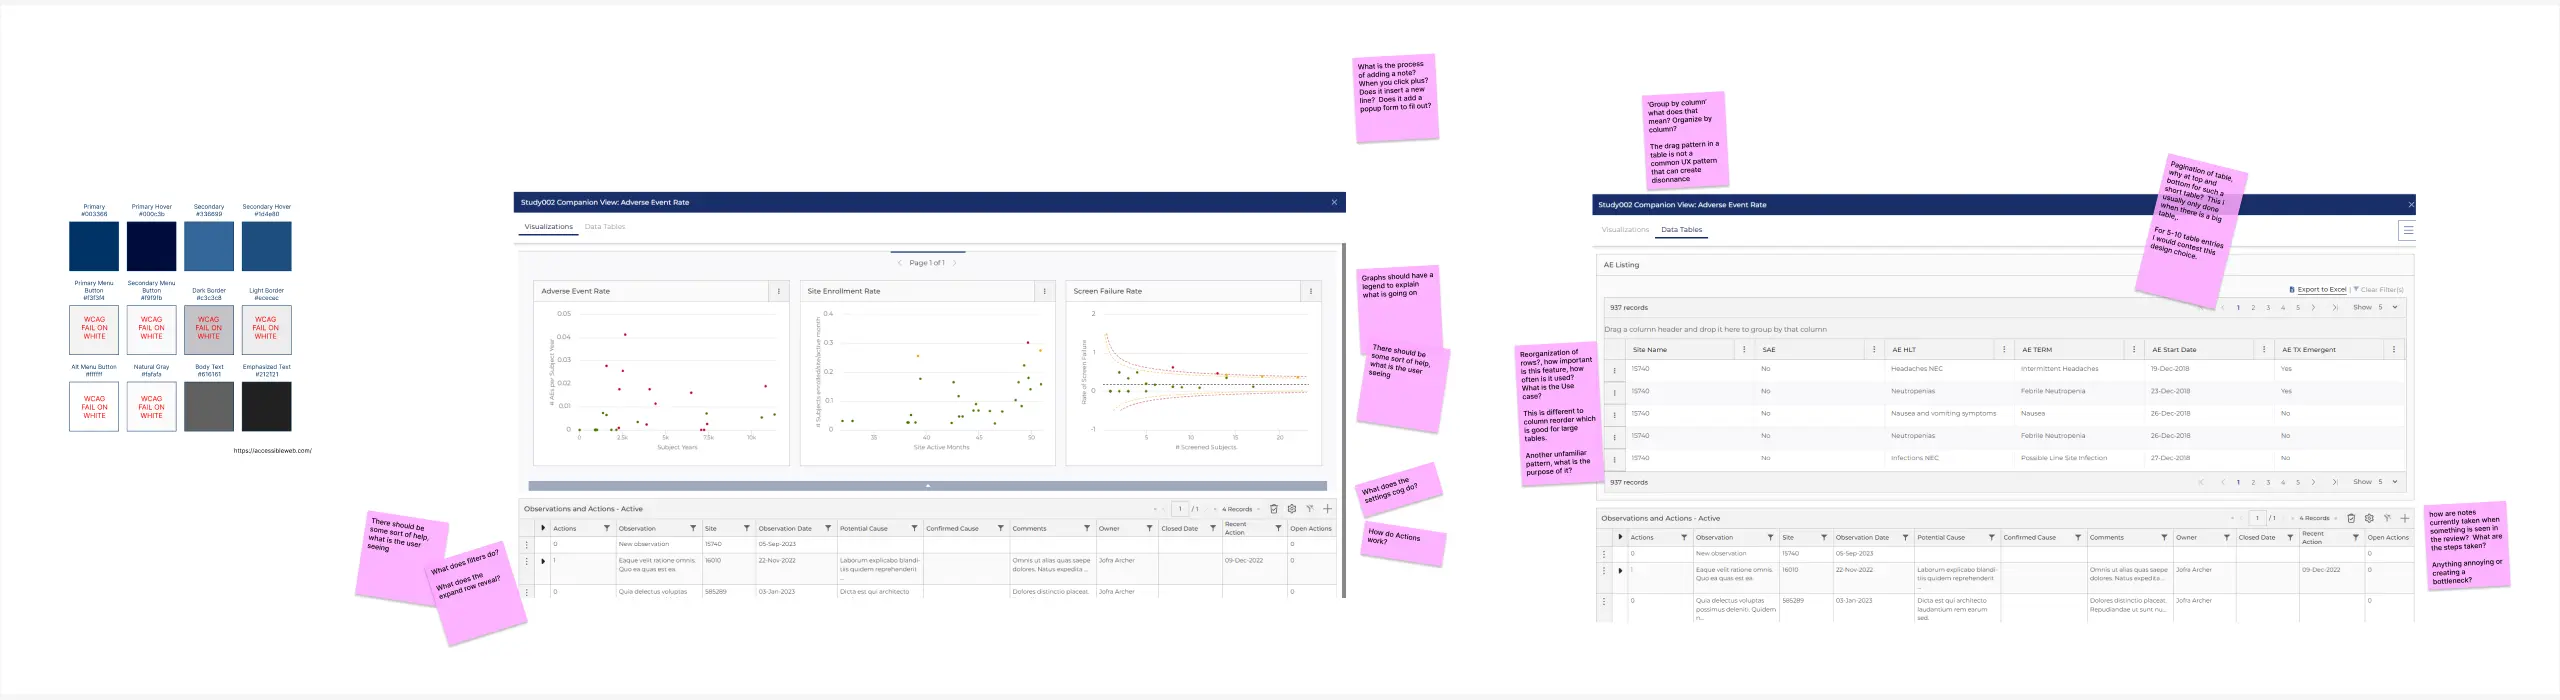
All audit findings
- Accessibility: 6 of the 12 brand colours failed WCAG contrast on white.
- Charts without legends, so users had to guess what they were looking at.
- Unfamiliar table patterns: "drag a column header here to group", and pagination at both top and bottom of a 5-row table.
- Unexplained controls: nothing said what the filters, settings cog or expanding rows did.
One screen for the data, notes in a slide-out panel
Charts and the listing share one page; observations slide in without hiding the data.
- Charts and table together: a scrollable strip of charts above the adverse-event listing.
- Notes slide in from the right, so reviewers keep the data in view.
- Faster note-taking: "Add an observation" opens from a listing row, pre-filled.
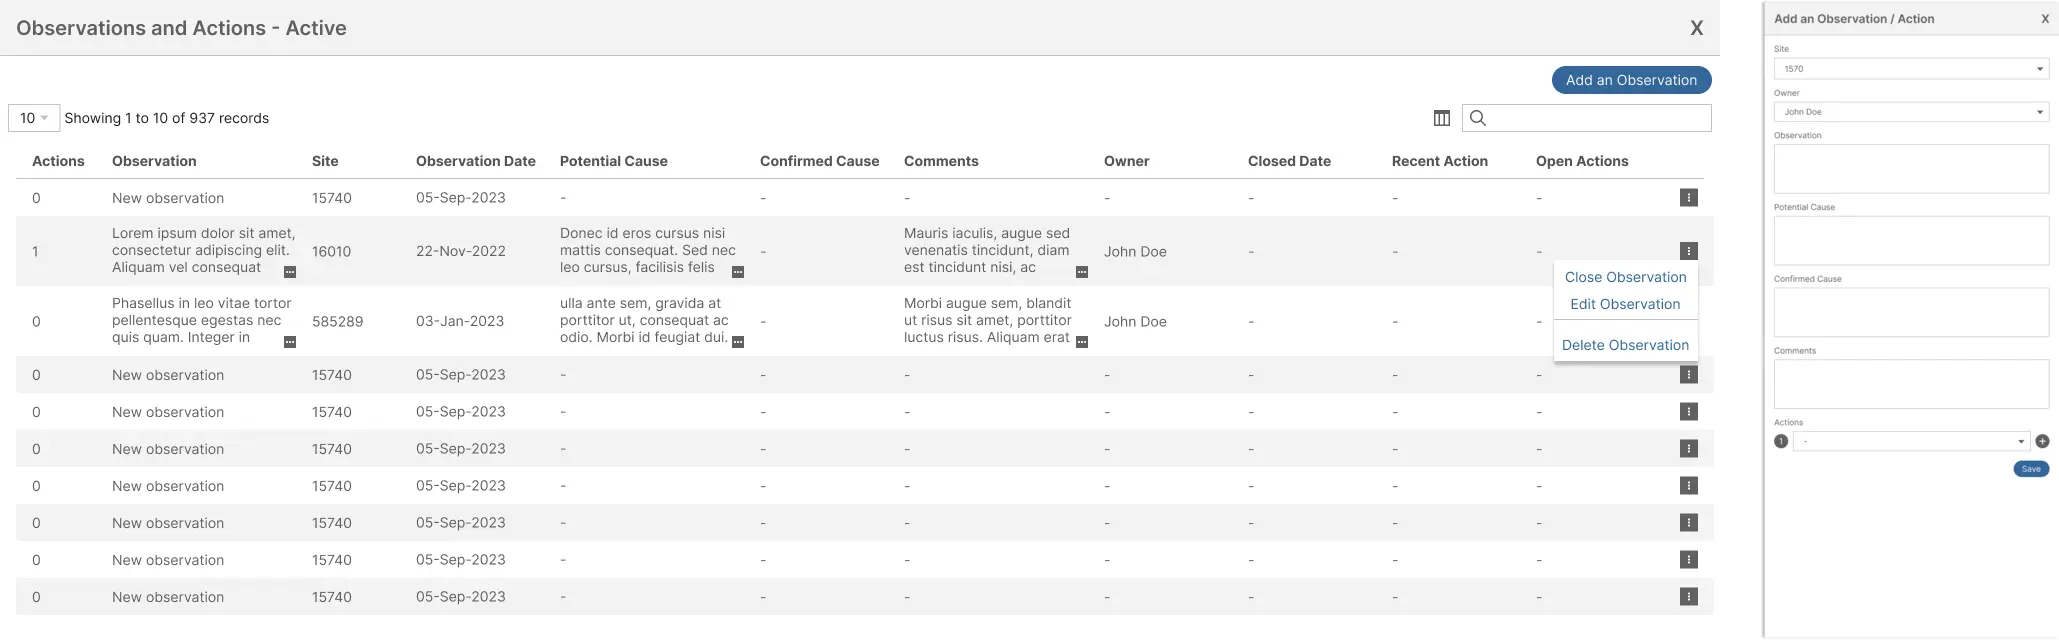
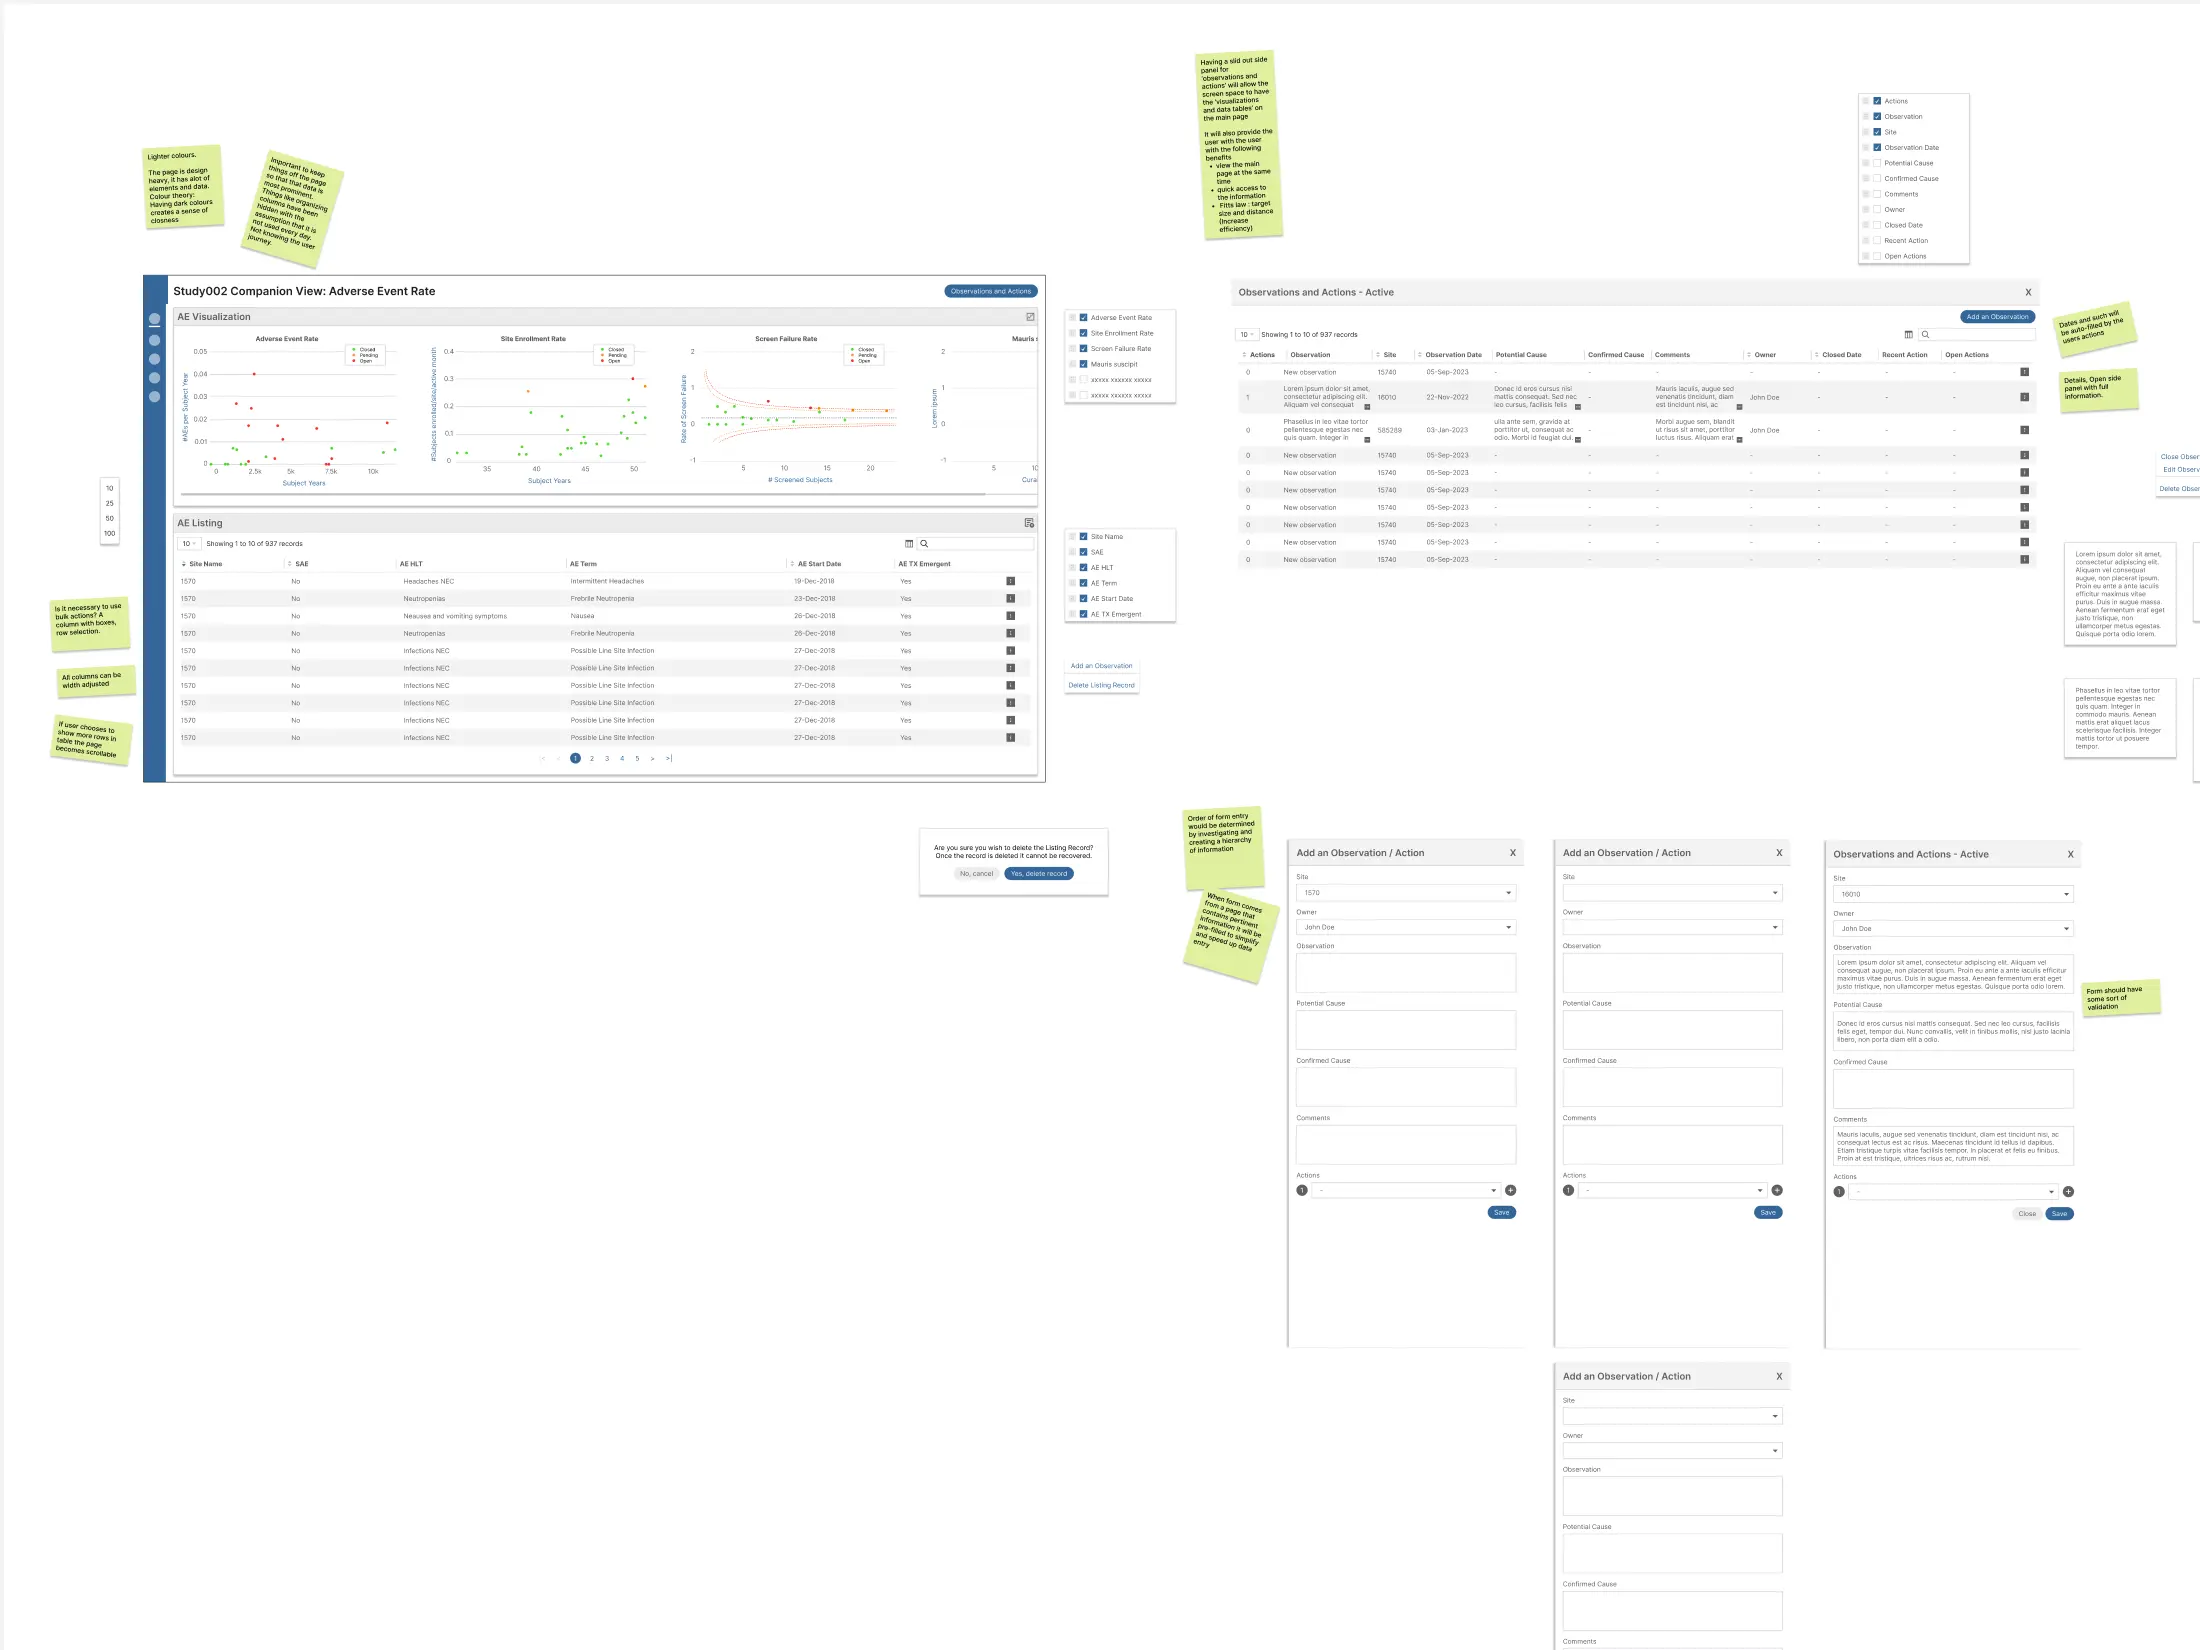
Design decisions and the annotated board
- Rows on demand: 10, 25, 50 or 100 rows; more rows make the page scroll.
- Tables users can shape: show, hide, reorder and resize columns, sort and search. The layout could be saved to each user's account.
- Large, close targets: the slide-out puts actions next to the data (Fitts's law).
- Form order by importance, with site and owner pre-filled from the listing and as many actions as needed.
- Safer and lighter: confirmation before anything is deleted, lighter backgrounds, and the brand blue kept for actions.
What I'd do with more than 48 hours
Test it with real reviewers.
The exercise gave me no access to users, so the design rests on the brief and my audit. With more time I would watch reviewers work through real cases, set the form order from how they actually record findings, fix the palette for contrast, and ask the team why features like column grouping exist before removing them.